Key Metrics for Measuring Finance Team Efficiency in the Billing Close
Five metrics reveal where your billing close actually breaks.

Most finance teams measure the close the way a coach measures a season by the final score: did we close on time, yes or no. That binary hides everything worth knowing, because the billing close is not one event but a chain of smaller processes, each with its own way of breaking. Usage data, contract variations, deferred revenue schedules, and credit notes all land in the same window, and errors in one feed compound errors in the next faster than they would in a plain subscription business. Finance teams that measure efficiency through a layered set of metrics, cycle time, error rate, auto-match rate, backlog, and hours per revenue dollar, get a picture of where the process actually strains, rather than a single number that only tells you whether it survived.
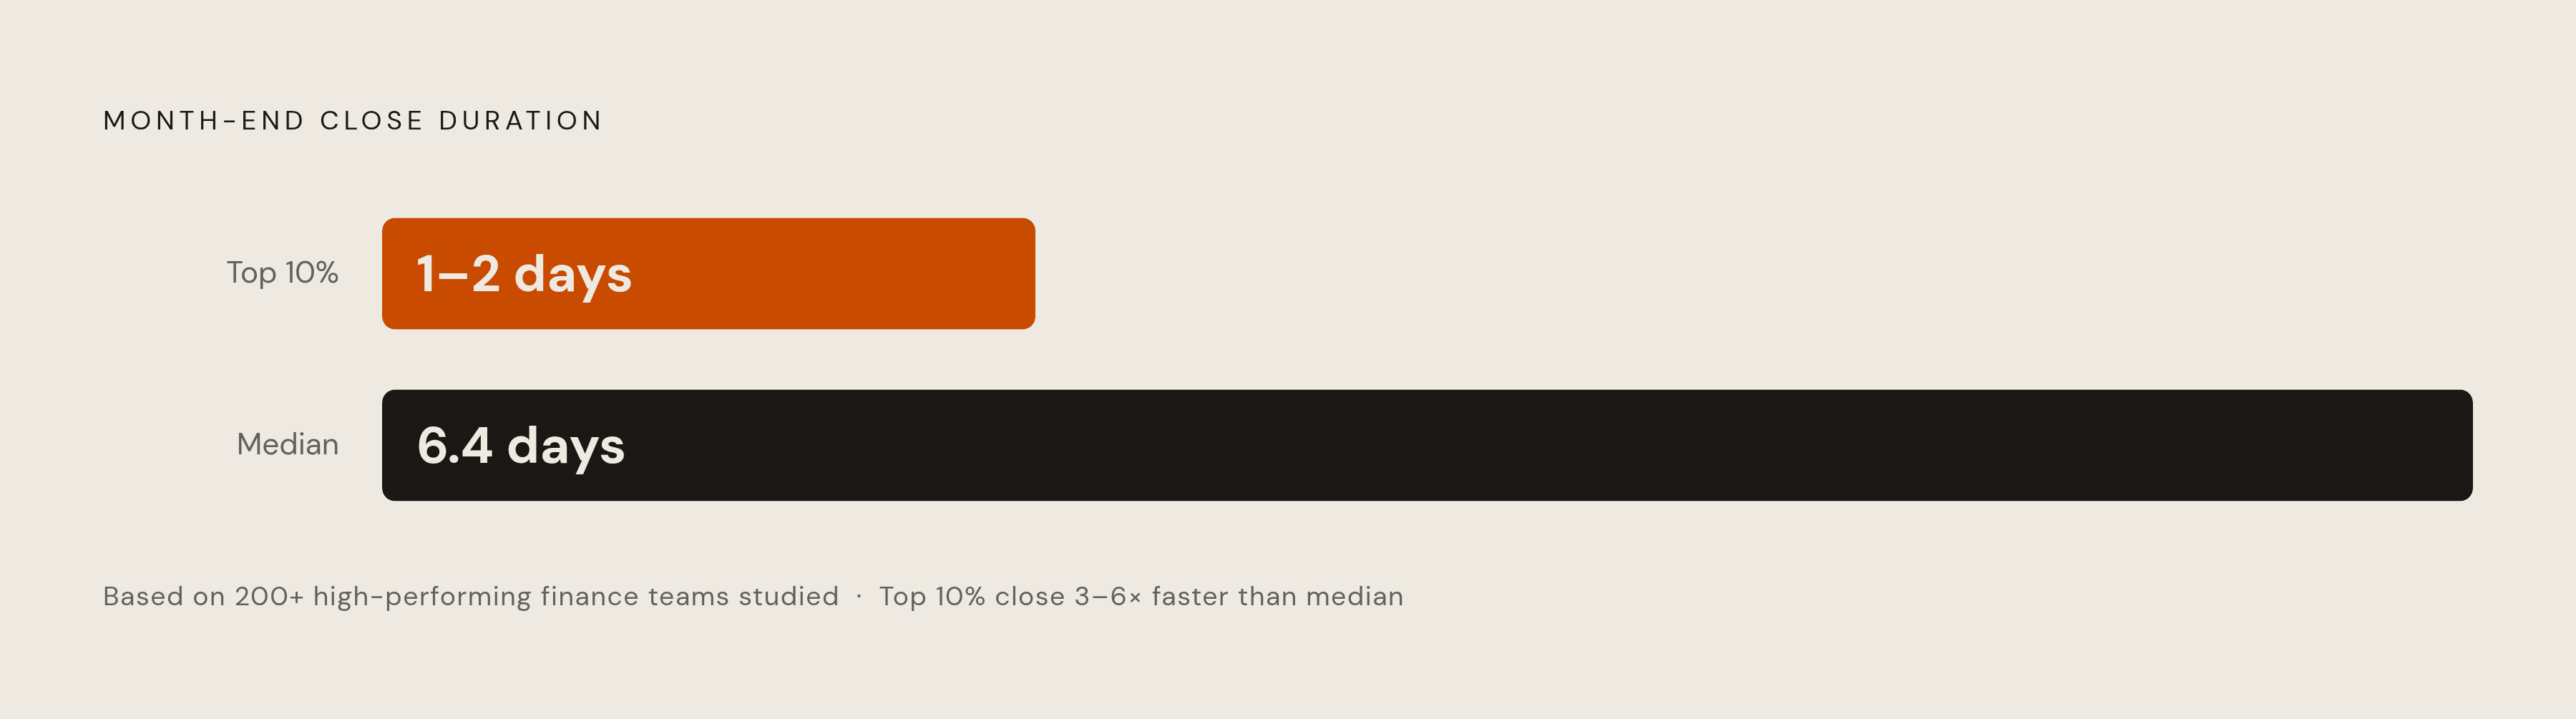
The scale of the problem appears in the benchmarks. The median month-end close across finance teams runs 6.4 days, and revenue recognition adjustments eat a disproportionate share of that time once a company bills on subscription or usage-based terms. That average buries a wide split: the top 10% of finance teams studied, across more than 200 high-performing teams, close in 1–2 days, while the rest scramble through the full week or beyond How to Speed Up Your Month-End Close Process in 2026. Those two groups differ not in who's smarter or who works harder. It comes down to whether a team is watching the right signals during the close and adjusting the process because of them.
That gap matters more now than it did five years ago. Compliance demands have tightened, and finance leaders are expected to do more than report what happened after the fact. Boards and CFOs want an explanation of what the numbers mean, what comes next, and what the business should do in response, a shift from scorekeeper to strategic partner. None of that is possible if the close eats the first week of the month and leaves no headroom for analysis.
Reconciliation cycle time: the headline metric
Cycle time counts the days between period close and final approval of every reconciliation, and it's the metric almost every finance leader already tracks, informally if not formally. A short cycle time points to clean documentation, efficient workflows, and a backlog that never had the chance to build. A long one points to a bottleneck, somewhere in data collection, investigation, or review, but the raw day count on its own doesn't say which.
That's the core weakness of cycle time as a standalone number: it's a lagging indicator. Worse, a fast close can be deceptive in the other direction. A team can technically close in six days while sitting on dozens of provisional postings and a deferred error queue that never got resolved, just pushed past the deadline https://www.cfo.com/news/50-of-finance-take-week-to-close-books-ledge-month-end-close-time-cfo-three-day-close-myth-/746085/. The clock stops. The work does not.
A companion measure fixes part of that blind spot: the percentage of reconciliations completed on time, say ninety of a hundred accounts cleared by the scheduled date, rather than by the close date overall. That adds a denominator pure days-to-close doesn't have, and it separates teams that finish everything from teams that finish enough to declare victory.
For billing specifically, cycle time gets inflated by three recurring waits: time spent waiting on usage data to finish landing, time spent resolving contract edge cases, and time spent working through deferred revenue schedules. That means cycle time functions as a symptom metric, not a root-cause one. It tells you something is wrong. It does not tell you what.
Error rate: what the recent Deloitte benchmark reveals about manual billing workflows
Error rate counts how often a reconciliation cycle requires correction: incorrect postings, coding mistakes, missing documentation, adjusting entries made after the fact. It sounds abstract until it's run against real volume. Take a firm processing 500 entries a month. A rate that reads as small in percentage terms turns into a stack of open items in absolute terms, and that stack is what actually consumes an analyst's week.
Post-close adjustments are the clearest downstream signal of this problem: correcting journal entries made after the close because a reconciliation issue got missed the first time. A high count here does two things at once. It draws more audit scrutiny, and it quietly erodes how much stakeholders trust the numbers finance already reported as final. Balance sheet accuracy, measured by how many accounts need correction after close, is the same failure showing up one level up in the financial statements.
Error rate and cycle time aren't independent, either. A team under deadline pressure can hit a fast close by deferring the hard investigations rather than resolving them, and that deferral raises a spike in post-close adjustments later. The close looked efficient. It wasn't.
Usage-based and AI product billing raise the stakes here considerably. Once a bill spans multiple pricing dimensions, tokens, compute minutes, credits, the number of ways an entry can be misclassified or simply missed multiplies with it. A subscription invoice has one or two variables to get wrong.
Auto-match rate: the clearest signal of automation maturity in the billing close
Auto-match rate is the percentage of transactions that clear automatically through system rules, with no human review. It is arguably the single cleanest read on how mature a team's automation actually is. It isn't a survey question or a self-assessment, it's a number the system produces on its own.
A high auto-match rate means the underlying rules are configured well, the data feeding them is clean, and reviewers aren't burning out from staring at line items all day. A low rate means the opposite: heavy reliance on manual comparison, more exposure to plain human error, and a hard ceiling on how fast the close can move regardless of how many people are thrown at it. Adding headcount doesn't fix a low auto-match rate, because the rules and the data that generate the match outcomes are the constraint, not labor.
Auto-match rate is also one of the few metrics on this list that predicts cycle time directly, rather than merely correlating with it. As the auto-match percentage climbs, the manual queue shrinks in proportion, and the close compresses along with it. Its mirror metric, manual intervention rate, tracks how often a human has to step in to clear an item; when that number is high, it's usually a sign of weak rule configuration or poor system integration rather than a workforce problem.
For teams billing on usage, auto-match rate ends up measuring something upstream of finance: whether the metering system produces clean, reconcilable event records in the first place, or finance ends up manually chasing down mismatches between what the product actually charged and what the billing system recorded. Automation on the reconciliation side helps, but only if the event data feeding it is trustworthy. Feeding a matching engine bad data means no amount of rule-building above it will save the match rate.
Reconciliation backlog and the unresolved exceptions queue
Backlog counts the discrepancies still open at period-end, and here, the dollar value matters as much as the count, arguably more. Ten small unresolved items may carry less real risk than a single large variance sitting untouched, and a backlog tracked only by item count can hide serious exposure behind a reassuring headline number.
The trend in that backlog over time says more than any single month's reading. A backlog that keeps growing means the close process isn't clearing items faster than new ones accumulate, and that gap widens quietly until it becomes visible as a crisis during an audit. Recurring exceptions clustered in one account type point somewhere specific: if revenue control accounts keep throwing variances month after month, that's not an analyst making mistakes, that's a posting rule or a system mapping that's wrong at the source. No amount of individual diligence fixes a structural error.
For AI and SaaS billing, the exceptions queue tends to hold the thorniest cases in the whole close: prepaid credit balances that don't reconcile against wallet records, usage that crossed a pricing tier partway through the period, invoices that went out before every usage event for that period had even finished being ingested. The headline cycle-time metric says the close finished on schedule. It says nothing about the six-figure exposure still sitting open in the exceptions queue, and that's exactly the kind of gap an auditor finds first https://www.cfo.com/news/50-of-finance-take-week-to-close-books-ledge-month-end-close-time-cfo-three-day-close-myth-/746085/.
Hours per revenue dollar: the efficiency metric that connects close performance to business scale
Hours per revenue dollar divides the labor hours the close consumes by the revenue processed, usually expressed as hours per million dollars in revenue. It's one of the most direct productivity benchmarks finance has, because it adjusts for scale. Cycle time and error rate say nothing about whether a team is efficient relative to how big the business actually is: a 4-day close at $10M ARR is a very different achievement than a 4-day close at $500M ARR, even though the day count reads identically on paper eltherion.com.
Cost per reconciliation breaks the same idea down to the account level: labor hours, software allocation, review time, and overhead, divided by the number of accounts reconciled. Overtime during the close period is the early warning sign that the ratio is heading the wrong way. A team absorbing growth through overtime hours isn't scaling its process at all, it's scaling how much its people can burn through before something breaks.
There's an efficiency ratio buried inside this efficiency metric, too: how much of the team's close time goes to manual data-gathering and error correction, versus actual analysis. A team spending most of its hours chasing down entries can't simultaneously deliver the forward-looking read that leadership now expects from finance. Deloitte's CFO survey found 81% of CFOs believe automation will free up time for higher-value planning and forecasting work, but that belief only turns into reality once the hours-per-dollar number actually improves. Deploying automation and improving the ratio are not the same event.
The fragmentation tax appears here first, and often appears here loudest. Companies that bolted a usage-based AI feature onto older subscription infrastructure are frequently running multiple billing codepaths at once, and reconciling three systems in parallel consumes labor at a rate no single-system close ever approaches. For a finance leader building the case to the CFO or the board for better billing infrastructure, hours-per-dollar is the number that translates process quality into a figure a non-finance executive can actually evaluate.
What the metrics cluster reveals when read together
No single metric on this list tells the whole story, and treating any one of them as the scoreboard is a mistake. Their value comes from reading them together, as a panel, the way a physician reads a set of vitals rather than fixating on one.
A few patterns recur often enough to name directly. Long cycle time paired with a low error rate usually means the team is careful but under-resourced or under-automated, working thoroughly through a volume that's outgrown its staffing. Short cycle time paired with a high post-close adjustment count means the opposite problem: the team is hitting its deadline by deferring or skipping the hard reconciliations, and deadline pressure has quietly overridden review discipline. Low auto-match rate combined with a growing backlog points to weak system integration, where staff manually clear items that rules should be handling, and the queue grows faster than anyone can work through it. High hours-per-dollar next to an otherwise acceptable cycle time means the business is absorbing growth through overtime and brute manual effort rather than genuine process improvement, and that close will not survive the next revenue doubling without structural change. And a concentration of recurring exceptions in one account category is rarely a performance problem. It's a structural one: the posting logic or system mapping needs to change, because no amount of coaching the analyst fixes a broken rule.
The principle behind all five patterns borrows from the balanced scorecard, seen in the fact that optimizing one number while ignoring the rest produces a metric that looks good on a slide and a close that's quietly getting worse. Pushing cycle time down while error rate climbs isn't progress, it's a trade the team hasn't noticed it made. Trends across periods carry more information than any single month's reading, because direction tells you whether the process is healing or degrading, and a single snapshot can't tell you that at all.
How billing infrastructure determines the ceiling on these metrics
Every metric in this panel, auto-match rate, error rate, hours-per-dollar, has a ceiling set upstream of finance entirely: the reliability of the event data feeding into the close. If the metering system produces records that are ambiguous or arrive late, no amount of reconciliation discipline downstream makes up the difference. Finance can be flawless and still inherit a bad number.
The failure mode repeats often enough among AI product companies to call it classic: the billing system can't accurately count usage events on its own, so finance manually reconciles between what the metering tool reports and what the billing system actually invoiced.
The pain compounds for companies running more than one billing codepath at a time, a common state once a subscription business bolts on a usage-based AI feature. Three systems means three separate data sources to reconcile, three distinct places for errors to hide, and a backlog that grows across all three surfaces every single month, not just one. A billing platform that keeps metering and billing inside one system, rather than stitching a separate metering tool to a separate billing tool, removes the reconciliation surface between the two entirely. That's a structural fix, and it's the change that actually moves auto-match rates and error rates. Process discipline alone can't get there.
The build-versus-buy decision drives this whole discussion, even when nobody names it directly. Teams that build billing infrastructure in-house tend to own the reconciliation gap indefinitely, because the engineers who built the metering system and the engineers who built the invoicing system are rarely the same people, working from the same assumptions, on the same timeline. The seam between their two systems doesn't disappear. It lands in finance's exceptions queue, every month, indefinitely. Finance leaders evaluating billing infrastructure would do well to treat auto-match rate and post-close adjustment count as acceptance criteria going in, not just as operational metrics to watch after the fact. A platform that can't move those two numbers hasn't solved the billing close, whatever else it claims to do.
Building a measurement cadence that makes these metrics actionable
None of this matters without a rhythm for checking it. Start narrow: cycle time, error rate, and auto-match rate form the highest-signal trio for most billing close teams, and they're the three worth instrumenting first. Hours-per-dollar and backlog value make sense to add once the team has the first three running cleanly, since both take longer to read and require more mature reporting underneath them.
During the close itself, the exceptions queue deserves daily attention, both its size and how long items have been sitting in it. That's the point in the cycle where problems are still cheap to fix, before the deadline forces a choice between closing on time and closing correctly. Weekly, a flash report on in-progress reconciliation completion and reviewer turnaround catches slower-moving friction before it hardens into a pattern.
At the end of each close, record the four core numbers together: cycle time, final error count, post-close adjustment count, and auto-match rate for that period eltherion.com. These four are the raw inputs for every trend line discussed above, and they mean very little as isolated data points eltherion.com. Quarterly, step back further, to hours-per-dollar trends, cost per reconciliation, and recurring exception patterns by account type, since these move slowly and need several periods stacked side by side before they say anything reliable.
One structural habit is visible across the highest-performing finance teams studied, out of a group of more than two hundred: completing high-volume, routine reconciliations before month-end even starts, rather than stacking all of it into the days right after close. It's a small shift in sequencing.